| Comments (here below) to: Gerta Keller, Thierry Adatte, Gerald Baum, Zsolt Berner, Reply to ‘Chicxulub impact predates K-T boundary: New evidence from Brazos, Texas’ Comment by Schulte, Speijer, Brinkhuis, Kontny, Claeys, Galeotti & Smit, Earth and Planetary Science Letters (2008) in press, doi: 10.1016/j.epsl.2007.12.025 |
2. Placement of K-T boundary Schulte et al. claim that the K-T boundary is based on just two criteria {1}: (1) the evidence of an asteroid impact and (2) the mass extinction in planktic foraminifera [17]. In the early 1990s when the El Kef and Elles sections of Tunisia were studied by the ICS working group (including Keller), for the nomination of the K-T stratotype, the criteria for the placement{2} of this boundary include {4}: (1) the lithological break from marl to clay{3}, (2) the 2-3 mm oxidized red layer{5} at the base of the boundary clay, (3) maximum Ir anomaly{6} in the red layer, (4) Ni-rich spinels{7}, (5) the negative d13C shift{8}, (6) the mass extinction horizon{9} and (7) the first appearance of Danian planktic foraminifera{10} within a few cm of the base of the boundary clay [18]. Arbitrarily reducing this list to just two criteria, the mass extinction and asteroid impact, does not change the existence or importance of the other defining criteria. In our global analyses of over 100 K-T sequences, the most consistent markers are the mass extinction in planktic foraminifera, the first appearance of Danian species and the d13C shift. The d13C shift is a global oceanographic signal and therefore provides an independent check on paleontological and impact criteria, which is critical to avoid circular reasoning. One cannot test the hypothesis that the Chicxulub impact caused the K-T mass extinction by defining the impact as the K-T boundary, as Schulte et al. propose. At Brazos, we placed the K-T boundary at the first Danian species, the d13C shift, and the mass extinction [1]. These criteria fall at the same stratigraphic level 40 cm and 80 cm above the event deposit in the CMA-B outcrop and Mullinax-1 core, respectively. To avoid further misconceptions we show new paleontological and iridium data for the CMA-B outcrop in Figure 1. Schulte et al. criticized these K-T criteria as based "exclusively on secondary - at best - and poor stratigraphic markers", or that the d13C shift is "tentative at best and can only be useful in discontinuous sequences or low- resolution pilot studies." These statements are very puzzling to any paleontologist working on the K-T boundary. Instead, Schulte et al. place the K-T boundary at the base of the event deposit [2, Fig. 1] solely on the basis of reworked Chicxulub impact spherules and the belief that they represent the time of the K-T impact. This is circular reasoning at best. Our study demonstrates that there are no geochemical or paleontological markers, no mass extinction or significant faunal changes at the base of the event deposit (Fig. 1). |
| {1}This is quoted totally out of context. Schulte et al. did not state definition but correlation. Those have different meanings. Schulte et al. also mentioned why all the other criteria cannot be used with precision when correlating the Kef GSSP to Brazos. The placement of the KT boundary is based on correlation with el Kef, not on the definition of the KT boundary itself. I include here an earlier draft of our figure 1, which includes the carbonate measurements |
| (top) {2}The problem is that Keller et al think that Schulte et al. criticize the placement of the K-T boundary in el Kef, while Schulte et al. criticize the placement of the KT boundary at Brazos river! The correct placement at Brazos can only be achieved by correct correlation to the GSSP at el Kef, which Schulte et al. criticized. |
(top) {3}The lithological break from normal marl to normal clay is present at the base of the event bed, because the event bed does not belong to the normal background sedimentation (see fig1). The marl below has on average 15% CaCO3, the clay above 5% CaCO3. |
| (top) {4}This is the wrong definition for the placement of the KT boundary. The definition of the KT boundary is only a lithostratigraphic criterion, the 'golden spike' in the KT type section at el Kef. This golden spike is 'hammered' at the base of the conspicuous claylayer, including the red lamina at the base (see fig2). All the other mentioned criteria are derivatives of this position, but do not define the KT boundary. Those secondary criteria approximate the KT boundary, and work OK for the majority of KT sections, but fail to work in sections around the Gulf of Mexico, where invariably a thick clastic layer occurs at the KT boundary |
| (top){5} Oxidized red layer. Does not exist at Brazos, so cannot be used for correlation, or placement of KT boundary. |
| (top){6} Maximum iridium anomaly. At Brazos the iridium anomaly is spread out over 20 cm. The three published iridium profiles (refs) all put the maximum spike at different levels. Schulte et al. criticized that Keller et al put all these spikes at the same level, (convenient with Keller et al's placement of the KT boundary). Schulte et al. traced the original data that are given here (see iridium). Therefore, the iridium anomaly is not usefull for placement of the KT boundary in Brazos river, nor any other KT outcrop of the Gulf with thick clastic deposits. |
| (top){7} Ni-rich spinels. Only very few spinels were encountered on the interval of Ir enrichment. Not useful to place the KT boundary |
| (top){8} ∂13C shift. (see fig 2). This a tricky matter, which cannot easily be answered. The conclusion that this shift is comparable to the global oceanographic changes is speculative at best (see d13C section). Therefore not a usefull marker to place the KT boundary in the Brazos sections. |
| (top){9} Mass-extinction. The Maastrichtian mudstones contain about 200 specimens/cm3 of mudstone. The first mudstones above the graded clastic layers less that 15/cm3. If we exclude the clastic layers, where all the fossils are reworked, the mass extinction level should be drawn above the highest Maastrichtian mudstones. |
| (top){10} First Danian species. As Schulte et al. criticized, this criterion is not part of the GSSP KT boundary definition at el Kef, because the first appearance is above the KT boundary. Yet Keller et al consistently use this as the main criterion to define the KT boundary at Brazos! |
| (top) This is a curious mix-up. In all expanded and complete sections, foremost at the GSSP in El Kef, the mass-extinction and the first appearance of Danian species are at different levels. Yet only the mass-extinction Coincides with the KT boundary. |
| (top) Any paleontologist working at the KT boundary (I assume foraminiferal workers) with skilfull experience in the field with a handlens, or using washed residues from below and above the KT boundary will notice the sudden disappearance in species and numbers of specimens exactly at the KT boundary in all those 100 sections. It is very hard to miss! Also at Brazos river, although the mudstones are generally poor in foraminifers, these is a enormous difference in abundance both in specimens and species between the highest Maastrichtian sample (just below the event beds) and the first mudstones above the graded interval. |
| Here below follow some comments on the reply by Gerta Keller, Thierry Adatte, Gerald Baum, Zsolt Berner (in Press) 2008 to <<Chicxulub impact predates K-T boundary: New evidence from Brazos, Texas’, a comment by Schulte et al.>> , which is a critique on: |
| G. Keller, T. Adatte, Z. Berner, M. Harting, G. Baum, M. Prauss, A. Tantawy, D. Stueben, Chicxulub impact predates K-T boundary: New evidence from Brazos, Texas, Earth and Planetary Science Letters 255 (2007) 339-356 |
(i) Misplacement of the K-P boundary (top) The "golden spike" of the global boundary stratotype section and point (GSSP) of the basal Danian (= basal Paleocene and basal Paleogene) is located at the base of the (black) boundary clay at El Kef, Tunisia. The primary criteria for correlation of the base of the Danian (i.e. the K- boundary) by the International Stratigraphic Commission (ICS, www.stratigraphy.org) and outlined in Molina et al. (2006) are: (1) evidence for asteroid impact (Iridium anomaly, Ni-rich spinels, shocked quartz, spherules etc.) and (2) major extinction horizon, including planktic foraminifers and calcareous nannofossils. Numerous previous studies reported iridium anomalies up 0.5 ng/g in Brazos K-P sections and cores starting in the top of the spherule-rich event bed and peaking with up to 1.5 ng/g about 10-20 cm above it, though the exact level and magnitude of the iridium peaks varies between sections and cores (see Fig. 1 and Hansen et al., 1987; 1993). The onset of the multiple iridium anomalies on top of the spherule-rich event bed at Brazos is explained by the ejecta spherules at proximal locations to Chicxulub comprising rapid, ballistically-transported target rocks, whereas the Ir-rich extraterrestrial material was lofted by the hot ejecta plume well-above the atmosphere and settled considerably later (e.g., Smit, 1999; Claeys et al., 2002; Kring, 2007). At regions distal to Chicxulub, e.g., at El Kef, Tunisia, these two distinct impact layers merge to one layer rich in ejecta spherules, shocked minerals, and iridium (see Fig. 1). However, by discussing the iridium enrichments at the Brazos Riverbed section, Keller et al. aligned all plots in their Fig. 8 giving the false expression that the three major iridium peaks are at the same level well above the spherule-rich event bed (see a comparison from Keller et al.'s Fig. 8 with the original iridium data in our Fig. 1). Moreover, Keller et al. state on page 352 that "...the sudden mass extinction of all tropical- subtropical planktic foraminifera is diminished in the Brazos region ...". The absence of a sudden mass extinction event at Brazos is, however, in stark contrast to the observations in numerous K-P sections, where the mass extinction of tropical planktic foraminifera is abrupt (e.g., Keller et al., 2002) and coincident with a sharp drop of the calcareous nannofossil abundance (e.g., Pospichal, 1996; Gardin and Monechi, 1998). Therefore, Schulte et al. criticize Keller et al. principally on the fact that they (a) fail to provide the characteristics in support of a clear K-P boundary position according to the official primary criteria as shown above and (b) instead of employing the primary criteria (evidence for asteroid impact, planktic extinctions, see Fig. 1) to correlate the base of the Danian, Keller et al. rely exclusively on secondary - at best - and poor stratigraphic markers to position this level at Brazos as outlined in the following. Keller et al. place the K-P boundary at the level of the lowest occurrence (LO) of several Paleocene microfossils (planktic foraminifera and organic-walled dinocysts) at 40-80 cm above the top of the spherule-rich event bed. Additional support for this K-P boundary level is thought to be provided by a d 13C minimum observed in the coarse silt fraction (38-63 ?m; i.e. small and juvenile planktic and benthic foraminifera) and in Lenticulina spp. (benthic foraminifera). This approach for positioning the K-P boundary is tentative at best and can only be useful in discontinuous sequences or low-resolution pilot studies. The beds overlying the spherule-rich event bed, however, are not discontinuous and the sequence is quite expanded compared to the majority of K-P boundary sequences worldwide. Many studies have provided evidence that the LOs of Paleocene microfossils are irrelevant in determining the precise placement of the K- P boundary (see Fig. 1 and Brinkhuis and Zachariasse, 1988; Odin, 1992; Olsson and Liu, 1993; Bown, 2005; Molina et al., 2006; Schulte et al., 2006). As yet, there is not a single stratigraphic marker species within any biotic group, which LO coincides with the base of the Danian in an expanded continuous sequence. Instead, among planktic foraminifera the basal Danian is usually characterized by survivors, often associated with specimens that are likely to have been reworked, as found at El Kef and at Brazos River too (e.g., Speijer and Van der Zwaan, 1996; Arenillas et al., 2000; Schulte et al., 2006). The planktic foraminiferal biozonation applied by Keller et al. (2007) does not follow internationally accepted definitions. Biozone P0 is defined as the biostratigraphic interval characterized by the partial range of Guembelitria cretacea between the highest occurrence of large Cretaceous taxa and the lowest occurrence of Parvularugoglobigerina eugubina (Keller, 1988; Berggren et al., 1995). Since Keller et al. do not record the simultaneous extinction of Cretaceous taxa (see page 352) the base of Biozone P0 cannot be established based on these data. It is also quite surprising that Keller et al. use the simultaneous LOs of W. hornerstownensis , G. daubjergensis , and P. extensa as a K-P marker since the same pattern has been used before as evidence for stratigraphic incompleteness by Keller et al. (2002). These taxa, in fact, show a discrete succession of first evolutionary appearances in the lowermost Danian. According to Keller et al. (2002), the youngest one of these is the LO of G. daubjergensis as high up as subzone P1a. Clearly, this reconfirms that the LO of Paleocene planktic foraminifera is not suitable for accurately correlating in this or any other K-P boundary sequence (Fig. 1). Keller et al. (page 348) also claim that the LO of the dinocyst Damassadinium californicum (= Danea californica ) is a "global K-T marker". Global distribution patterns of D. californicum , however, provide no support for this claim. This species first occurs at 15 cm above the K-P boundary in the El Kef GSSP section, near the top of the Guembelitria cretacea (P0) planktonic foraminiferal zone (see Fig. 1 and Brinkhuis et al., 1998). In the Seymour Island K-P sections, Antarctica, D. californicum has its LO about 20 cm above the Ir peak (Elliot et al., 1994). Closer to Brazos, at Moscow Landing in Alabama, D. californicum first occurs 129 cm above the K-P boundary (Habib et al., 1996). Even in condensed K-P sections such as Caravaca, Spain, the LO of D. californicum is still situated above the K-P boundary (Brinkhuis et al., 1998). Hence, in relatively expanded K-P sections - as Brazos is - there is always a significant stratigraphic interval of yet uncertain duration between the K-P boundary and the LO of D. californicum (c.f. Fig. 1). This "global K-T marker" is therefore merely a lower Danian marker, just like the planktonic foraminifera discussed above. Furthermore, Keller et al. show a complex d 13C curve with minima in both the coarse silt fraction, and in Lenticulina spp. , at the event deposit, followed by sharp recovery to pre-event values and a subsequent gradual decline to a minimum 0.4-0.8 m above the event deposit. In contrast, a sharp drop in planktic foraminifera and fine fraction d 13C values characterizes the K- P boundary level in more distal K-P sections (Keller et al., 1995; D'Hondt et al., 1998; Molina et al., 2006). Moreover, Fig. 3 of Keller et al. also reveals a strong correlation between d 13C values and calcite contents. Such a correlation may be taken to indicate strong diagenetic overprint (Marshall, 1992). Keller et al. provide neither an explanation for the unusual and gradual nature of the d 13C anomaly at Brazos, nor do they discuss the potential of diagenetic artifacts or reworking on the d 13C record of Lenticulina spp.. It is also not clear why Keller et al. chose the coarse silt fraction of 38-63 ?m for their study - this is an unusual size fraction for stable isotope bulk analyses, excluding calcareous nannofossils as well as micrite. Although Keller et al. do not indicate this, the studied size fraction is probably dominated by small-sized benthic and planktic foraminifera. It is well established that benthic foraminifera normally have lighter d 13C values than planktic foraminifera (e.g., D'Hondt et al., 1998). Since data on the relative proportions of benthic and planktic specimens are lacking - but are known to vary in the study area (Schulte et al. 2006) - inferring any relation to a global d 13C signal based on the 38-63 ?m size fraction is unwarranted. The anomalous patterns and the choice of using an unknown mix of foraminifera for stable isotope analysis undermine the claim that these d 13C records provide supporting evidence for the position of the K-P boundary. The patterns would rather support the idea of significant reworking of Cretaceous microfossils into deposits overlying the spherule-rich event bed (see next paragraph). (top) |
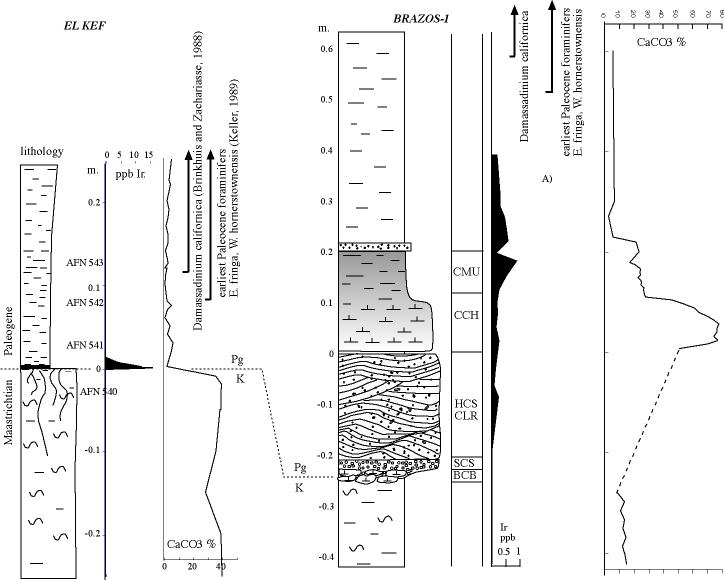
| Earlier draft of our fig1, including CaCO3 data. The transition at El Kef is clearly from CaCO3 rich (=marl) tot CaCO3 poor (=clay). At Brazos river the normal mudstones are CaCO3 poor throughout. Yet there is a decrease from about 15% in the Maastrichtian (-04 to -0.25m) to about 5% just above the rusty sandstone layer at 0.2m. The clastic layer (move mouse over image) is indicated by the arrow. So take away the clastic layer, and the KT boundary is in between, and the situation is identical as at El Kef. (top) |
 |
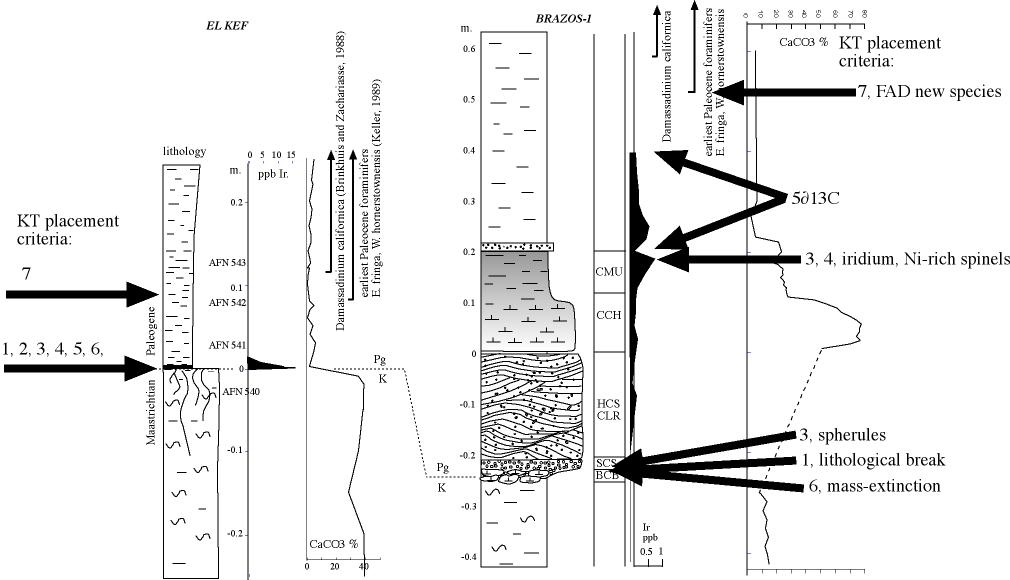 |
| Fig 2. (top) The different criteria to define and/or correlate the KT boundary, mentioned by Keller (above) |
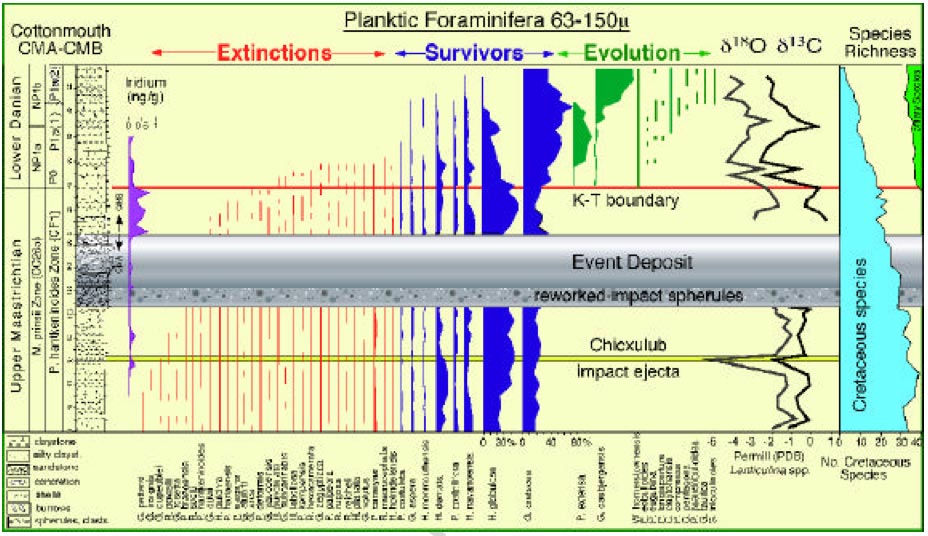 |
| (top) Fig 1 of Keller et al's reply. This figure requires comment, because it considers part of the event deposit as normal background sediment. However, as shown in fig 2, the interval directly above (move mouse over), the interval considered by Keller et al as normal deposit, actually belongs to the event deposit too, because it is grainsize-graded! This has important implications, because it means the iridium anomaly is not separated from the event deposit, but belongs in the top part of the event deposit itself. |
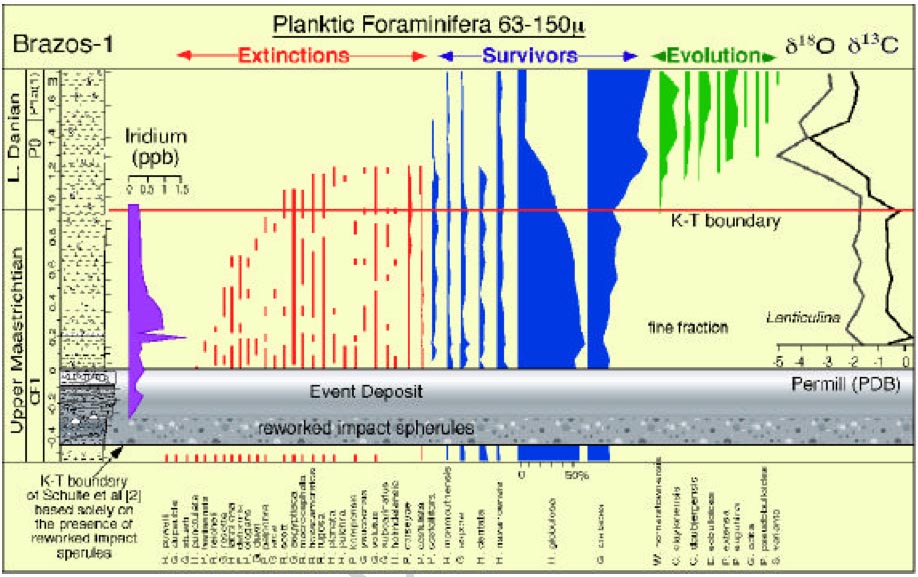 |
| (top) Fig 2 of the reply of Keller et al. This figure is misleading. As seen on the grainszize distribution (move mouse over), the interval directly above the interval labelled by Keller et al as event deposit, continues the grading from the event deposit and should be considered part of the event deposit. Note also that the d13C analyses are problematic. Throughout the section, foraminiferal shells are filled with calcite, which constitutes >80% weight of every specimen. Since it is extremely hard to remove the shells for separate analysis, the measurements presented here (basically the same as published in Barrera and Keller 1990) are for over 80% the values of diagenetically filled chamber, so what what are these values worth?? Therefore, the KT boundary placement by Keller at al can only be based on criterion 7, the first appearance of the Danian forminifers (the d13C being thus unreliable), disregarding the other 6. The first appearance of these Danian species, as we have shown in our critique, is considerably above the K/T boundary defined by the other 6 criteria. |
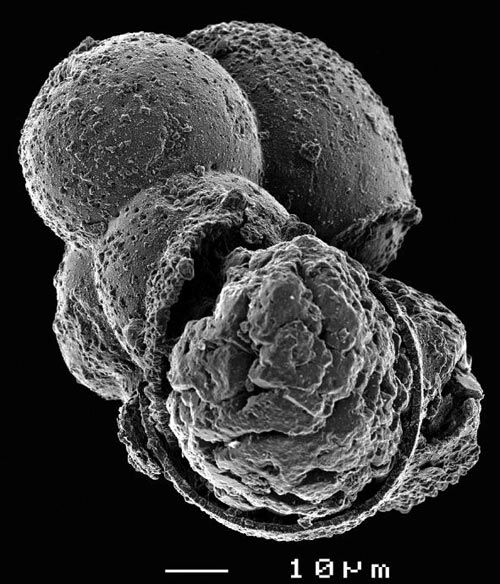 |
| (top) Typical planktic foram from the interval above the clastic beds, showing the blocky calcite infilling of the chambers. When measuring this specimen for stable isotopes, values will be dominated by the composition of the infilling. (back) |