| Comments (here below) to: Gerta Keller, Thierry Adatte, Gerald Baum, Zsolt Berner, Reply to ‘Chicxulub impact predates K-T boundary: New evidence from Brazos, Texas’ Comment by Schulte, Speijer, Brinkhuis, Kontny, Claeys, Galeotti & Smit, Earth and Planetary Science Letters (2008) in press, doi: 10.1016/j.epsl.2007.12.025 |
Ir anomalies and impact spherules 3.1. Iridium There is no iridium anomaly or impact spherule layer at the K-T boundary as defined by δ13C and standard micropaleontological critera in the Brazos sections. The three Ir profiles of the classic Brazos-1 outcrop were all done on the same section with just a few meters of lateral exposure and where a discontinuous thin rust-colored sand layer is present. Rocchia et al. [25] show the maximum Ir anomaly in the 1-2 cm below this layer and a second anomaly immediately above, just as we show in Fig. 8 [1]. Two minor Ir enrichments are present in the sandstone of the event deposit and just above it. Schulte et al. misrepresent our figure by placing the maximum Ir anomaly [25] above this sand layer in their Figure 1 and then argue that we misrepresent the data. The lithologs for the Asaro et al. [26] and Ganapathy et al. [27] Ir profiles are more sketchy and for this reason we consulted with Tom Yancey (Texas A&M University), who guided their field party and confirmed the positions of the main Ir peaks near the thin sand layer, as well as the smaller peaks below. Schulte et al. [2, 3] re-plotted these three sets of published Ir data in their Figure 1 based on Hansens et al.’s [28, 29] interpretation and inexplicably affixed the misleading label “original data”. We conducted Ir and PGE analyses of several other sequences, and find significant variations in the profiles due to variable erosion. For example, Ir profiles in the CMB-A and Brazos-1 sections where the K-T boundary is 40 cm and 100 cm above the event deposit are different because of erosion (Figs. 1, 2). |
| I don't understand this. I understood from the many publications, and by Kellers2008 own definitions of the KT boundary that the Ir anomaly almost defined the KT boundary (as it sure does at the GSSP at el kef). And now there is no iridium at the KT boundary at Brazos??? Then my conclusion would be that Keller2008 put the KT boundary at the wrong position |
| We provide here again Keller2007's figure, with data of the three original profiles below, so the reader can make his/her own judgement where the Ir peaks really are ! |
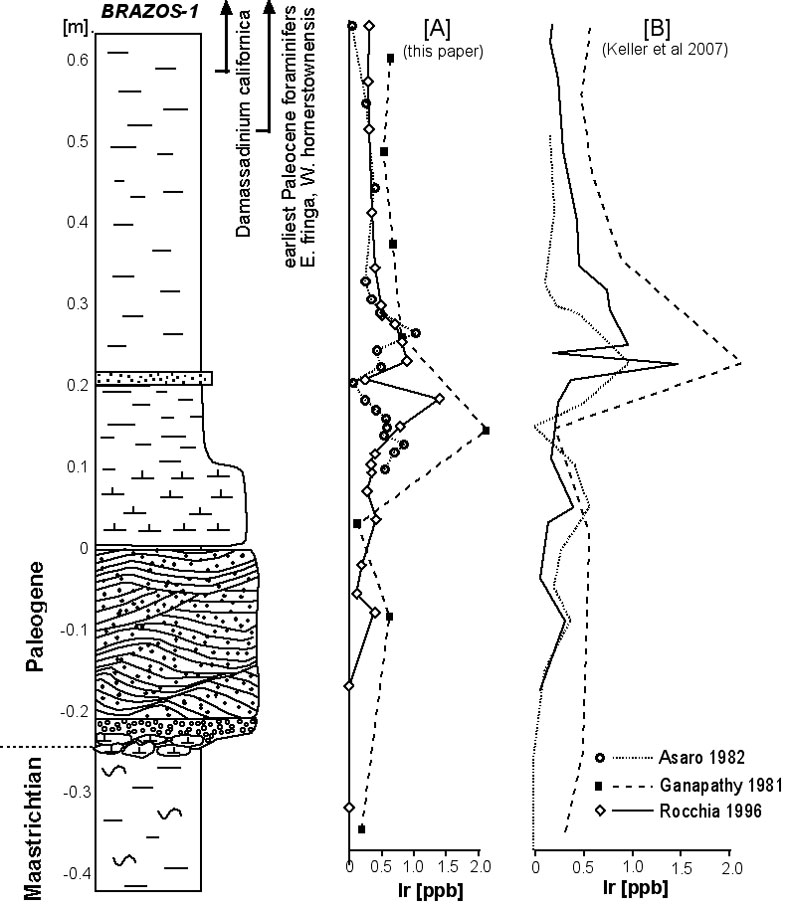
| Schulte et al did not misrepresent Keller2008's figure, they have drawn a NEW figure, using the original data, and copy/pasted Keller2007 curve next to it, with this important difference, schulte2007 shifted the Keller2007 figure8 10cm up, so it centered on the thin sandstone layer. Our zero level is at the base of the micrite layer, while Keller2007 use the top of the micrite layer as zero. We think the latter is unreliable, because of the gradational transition from hard micrite to mudstone, and depends on outcrop conditions. Note the difference between the figures, Keller2007 makes the distance between the top of the micrite and the sandstone is 20cm, while we have measured 10 cm. The point is, the figure 8 of Keller2007 shows all the maximum peaks exactly at one level i.e. the thin sandstone layer at 20 cm, while this is certainly not the case! |
| REFERENCES(top) |
| Keller, G., T. Adatte, et al. (2007). "Chicxulub impact predates K-T boundary: New evidence from Brazos, Texas." EPSL 255(3): 339-356. |
| Peter Schulte, R. P. S., Henk Brinkhuis, Agnes Kontny, Philippe and S. G. Claeys, Jan Smit (2008). "Comment on the paper: ”Chicxulub impact predates K-T boundary: New evidence from Brazos, Texas” by Keller et al. (2007) " Earth and Planetary Science Letters In Press Accepted Manuscript, Available online 11 January 2008. |
| Gerta Keller, T. A., Gerald Baum and Zsolt Berner (2008). "Reply to ‘Chicxulub impact predates K-T boundary: New evidence from Brazos, Texas’ Comment by Schulte et al. " Earth and Planetary Science Letters In Press, Accepted Manuscript, Available online 17 January 2008. |
| Zachos, J. C. and M. A. Arthur (1986). "Paleoceanography of the Cretaceous/Tertiary boundary event: inferences from stable isotopic and other data." Paleoceanography 1(1): 5-26. |
Barrera, E. and G. Keller (1990). "Stable isotope evidence for gradual environmental changes and species survivorship across the Cretaceous/Tertiary boundary." Paleoceanography 5: 867-890. (top) |
| Rocchia, R., E. Robin, et al. (1996). Stratigraphic distribution of extraterrestrial markers at the Cretaceous-Tertiary boundary in the Gulf of Mexico area: implications for the temporal complexity of the event. The Cretaceous-Tertiary Event and Other Catastrophes in Earth History. G. Ryder, D. Fastovski and S. Gartner. Boulder, Geol. Soc. of Amer. Sp. Pap. 307: 279-286. |
| Asaro, F., H. V. Michel, et al. (1982). Iridium and other geochemical profiles near the Cretaceous Tertiary boundary in a Brazos river section in Texas. Texas ostracoda, Guidebook of Excursion and related papers for the eights International Symposium on ostracoda. R. F. Maddocks. Houston, Univ. of Houston: 238-241. |
| Ganapathy, R., S. Gartner, et al. (1981). "Iridium anomaly at the Cretaceous-Tertiary boundary in Texas." Earth and Planetary Science Letters 54: 393-396. |
| Hansen, T., R. B. Farrand, et al. (1987). "Sedimentology and extinction patterns across the Cretaceous-Tertiary boundary interval in East Texas." Cretaceous Research 8: 229-252. |
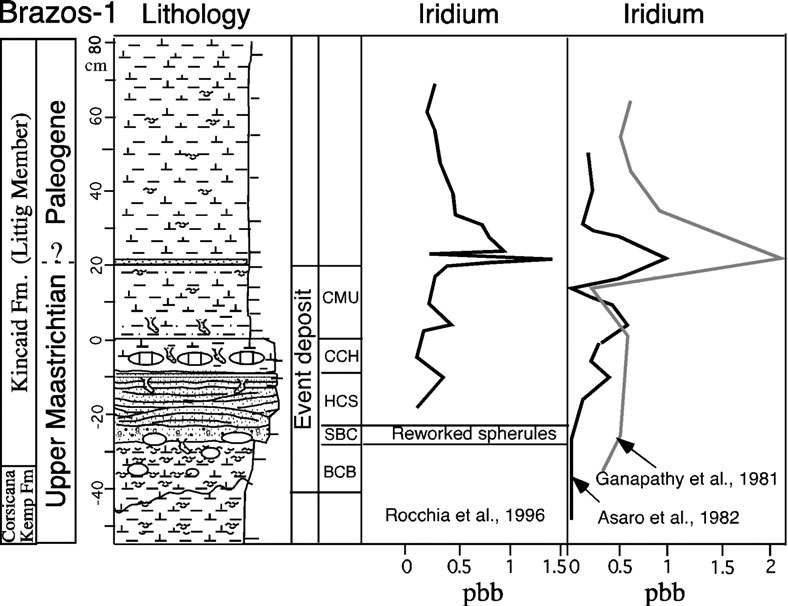 |
| Fig 8 of Keller2007, misleadingly 'showing' that all the main Ir peaks are at the thin sst layer at 20cm (move mouse over). On the contrary, Rocchia comments that the sst is low in iridium (top) |
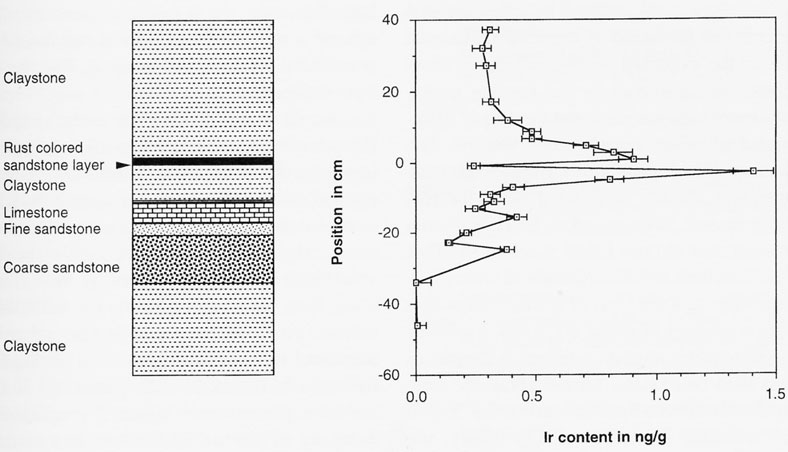 |
| From Rocchia et al 1996. I took the samples with Rocchia in 1994, so our column and Rocchia et al 1996 are one and the same. Althought the minimum peak seems at the lower end of the rust-colored sandstone layer (move mouse over), in his text Rocchia clearly states that the minimum value is from the sandstone(top) |
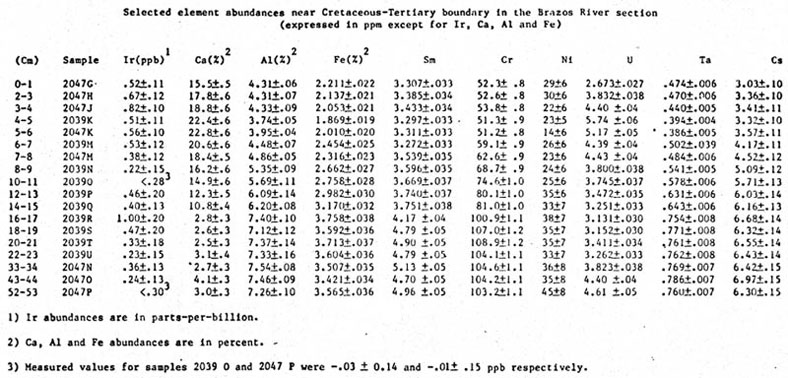 |
| (top) The original data from Asaro et al 1982. The distances given in this table are "in cm above the top of the micrite ledge", so in the figure below these are reconverted to the distance from the base of the ledge. (10 cm added). We plotted these data in the figure below, and then also Asaro measured a minimun Ir in the sandstone layer, so I guess our reconstruction is correct. |
 |
| Schulte2008 representation of the iridium peaks measure. If the Ganapathy data are reconstructed such as the -_-_-_ notation is unit E than the ir curve should be shifted upwards (move mouse over) |
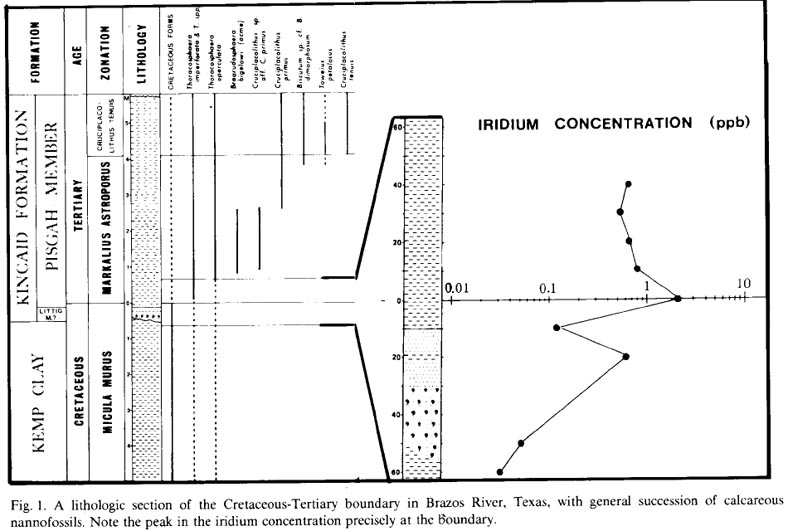 |
| The iridium concentration of Ganapathy1981. The position of the main peak is not clear. Ganapathy says it is exactly at the KT boundary defined on nannofossils, 10 cm above the sandstone layer. Whether the sandstone layer does or does not include the 10 micrite ledge is not clear, data on the red sandstone is not given. If the -_-_- notation in the detailed column indicates the thin silt between the sandstone and the micrite ledge (Hansens1987 bed E), then the maximum Ir could be near the thin sandstone. If the top of the sandstone is meant (as in the text is mentioned) than the Ir is somewhere near the top of the micrite. Here below is an outcrop photo from 1981 of Brazos-1, the same year the samples of Ganapathy were taken.(top) |
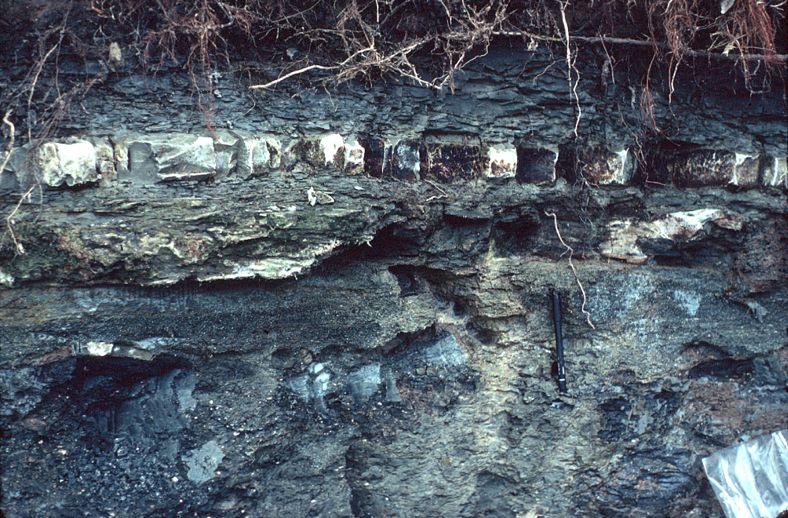 |
Outcrop of the Brazos-1 section in 1981, around
the time Asaro's and Ganapathy's samples for iridium were taken. Length
of the pen is 14 cm. Move mouse over to see the beds defined by Hansen1987. |